All official European Union website addresses are in the europa.eu domain.
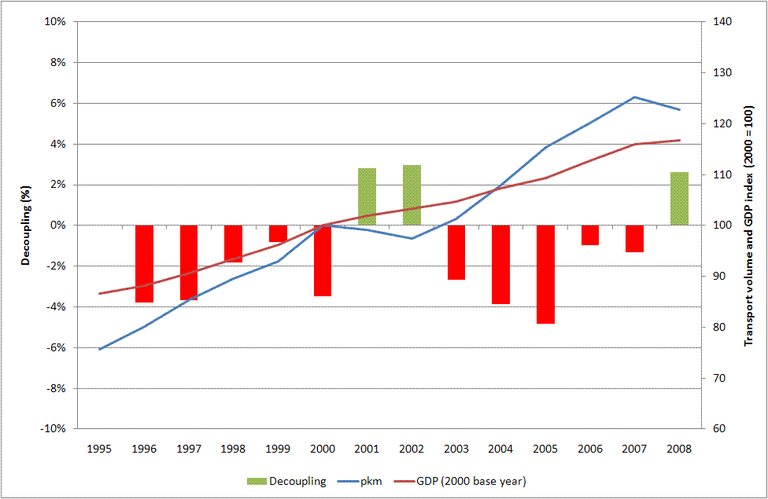
See all EU institutions and bodiesTrends in air passenger transport demand and GDP. The two curves show the development in GDP and air passenger transport volumes, while the columns show the level of annual decoupling. Green indicates faster growth in GDP than in transport while red indicates stronger growth in transport than in GDP.
Aviation passenger demand data are provisional estimates from the European Commission DG MOVE for domestic and intra-EU27 aviation. GDP data for Lichtenstein is not included as it is not available.
The ratio of annual growth of passenger transport to GDP, measured in 2000 prices, determines the amount of coupling between GDP and transport. The decoupling indicator, depicted by the green bars, is calculated as unity minus the coupling ratio; so a positive score indicates decoupling (i.e. transport demand grows less slowly than GDP), with a negative score showing the opposite (i.e. transport demand outpaces GDP growth)

