All official European Union website addresses are in the europa.eu domain.
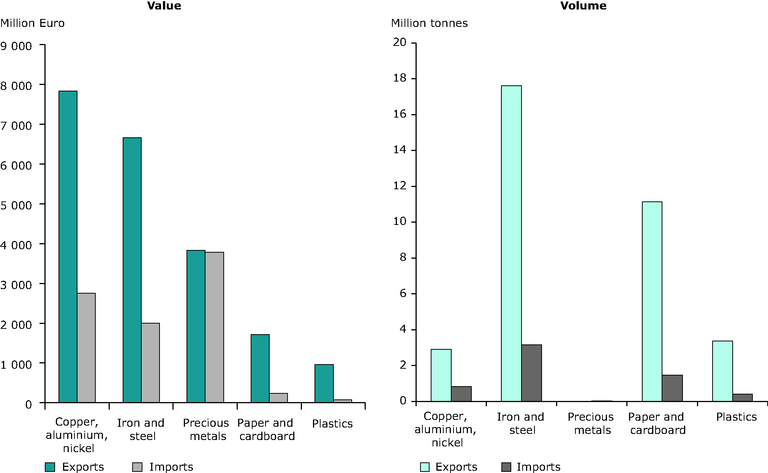
See all EU institutions and bodiesTrade in selected waste materials to and from the EU, 2011
Chart (static)
The figure shows the amounts and the value of selected non-hazardous waste materials that were exported and imported from/into the EU (excluding Intra-EU trade).

- EU27 trade since 1988 by CN8 (Eurostat)
- Greece
- Poland
- Romania
- Portugal
- Spain
- United Kingdom
- Netherlands
- Belgium
- Germany
- France
- Czechia
- Italy
- Cyprus
- Estonia
- Latvia
- Lithuania
- Finland
- Hungary
- Bulgaria
- Malta
- Denmark
- Sweden
- Austria
- Luxembourg
- Ireland
- Slovakia
- Slovenia
Methodology
For waste plastics, iron & steel, copper, aluminium and nickel; precious metals and paper and cardboard, data on waste exports/imports were extracted from Eurostat's international trade statistics database and summed into the material categories. The following product codes were selected: plastics: 39151000, 39152000, 39153000, 39159011, 39159013, 39159018, 39159019, 39159080, 39159090, 39159091, 39159093 and 39159099; Iron and steel: 72041000, 72042100, 72042110, 72042190, 72042900, 72043000, 72044910, 72044990, 72044991 and 72044999; Cu, Al, Ni: 74040010, 74040091, 74040099, 75030010, 75030090, 76020019 and 76020090; Precious metals: 71121000, 71122000, 71123000, 71129000, 71129100, 71129200, 71129900; Paper and cardboard: 47071000, 47072000; 47073010; 47073090; 47079010; 47079090. Exports/imports were calculated from the EU-27 out of the EU27/into the EU (select parnter: EU_extra) . The sum of all the waste types (codes) represents the total amount of exports/imports of the respective waste material. In order to convert the waste export amounts into million tonnes, the sums of the raw values (as extracted from the Eurostat database) is divided by 10000000 for volumes and by 1000000 for values.
