All official European Union website addresses are in the europa.eu domain.
See all EU institutions and bodies
An official website of the European Union | How do you know?
Environmental information systems
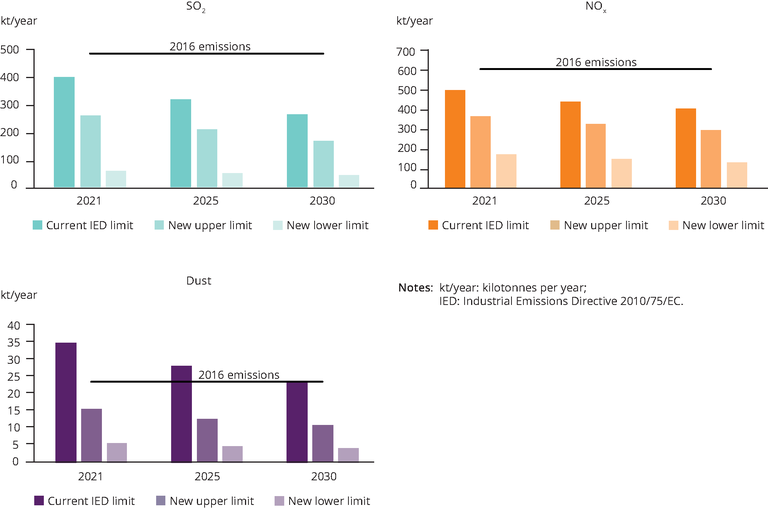
The three graphs show the progression of total SO2, NOx and dust emissions between 2016 and 2030 given 3 different scenarios: if current IED emission limits are applied, if only the upper emission limits of new requirements are implemented or if implementation is strictly according to the lower emission limits of new requirements.
Loading