All official European Union website addresses are in the europa.eu domain.
See all EU institutions and bodies
An official website of the European Union | How do you know?
Environmental information systems
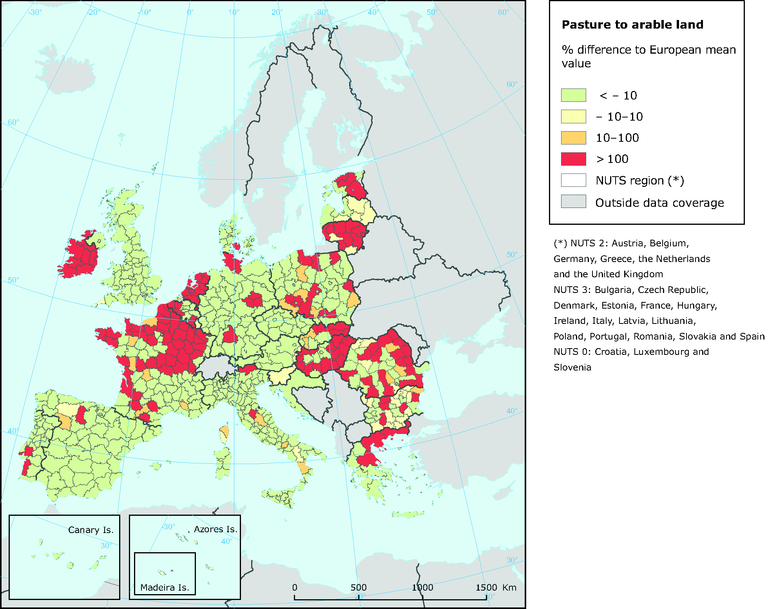
This maps shows the deviation from average of the conversion between pasture and arable land (1990-2000), represented by NUTSX (NUTS3, NUTS2 mainly, NUTS0 in a few cases)
Loading