All official European Union website addresses are in the europa.eu domain.
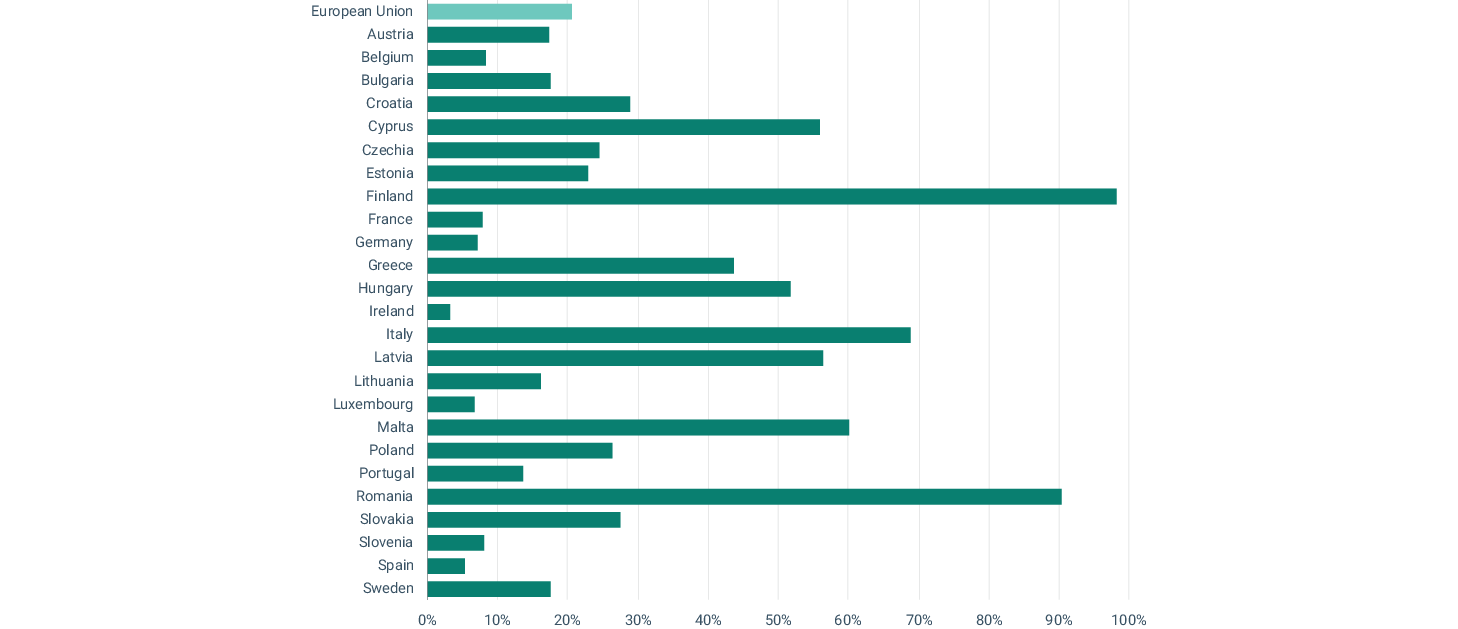
See all EU institutions and bodiesShare of livestock units for which EU Member States have planned CAP-supported interventions to limit the use of antimicrobials over the implementing period 2023-2027
Chart (static)

This indicator is part of the CAP result indicators’ dashboard developed by the European Commission. The figure shows the share of animals (expressed in livestock units, or LU) for which EU Member States have planned CAP-supported interventions related to the prevention or reduction of antimicrobial use over the implementing period 2023-27. The full methodology is available at EC, 2023b.
NB: The result indicator was not planned by Denmark and the Netherlands. The result for Belgium is calculated by aggregating the values relating to the Flanders and Wallonia regions, which in the CAP result indicator dashboard are presented separately because these regions submitted two separate CAP strategic plans.
- CAP Result indicators dashboard
- Austria
- Belgium
- Bulgaria
- Croatia
- Cyprus
- Czechia
- Estonia
- Finland
- France
- Germany
- Greece
- Hungary
- Ireland
- Italy
- Latvia
- Lithuania
- Luxembourg
- Malta
- Poland
- Portugal
- Romania
- Slovakia
- Slovenia
- Spain
- Sweden
Methodology
The full methodology is described in the following publication by the European Commission: https://agriculture.ec.europa.eu/system/files/2023-09/pmef-result-indicators_en.pdf
Please note that while the implementing period of CAP Strategic Plans runs from 2023 to 2027, the temporal coverage of this chart includes the 2028 and 2029 financial years as some actions can be paid under the CAP until financial year 2029, and some Member States may have planned milestones for their result indicators also in those years.
Additional information
The indicator is part of the CAP result indicators’ dashboard developed by the European Commission. The indicator was not planned by Denmark and the Netherlands. The result for Belgium is calculated by aggregating the values relating to the Flanders and Wallonia regions, which in the CAP result indicator dashboard are presented separately because these regions submitted two separate CAP Strategic Plans.
