All official European Union website addresses are in the europa.eu domain.
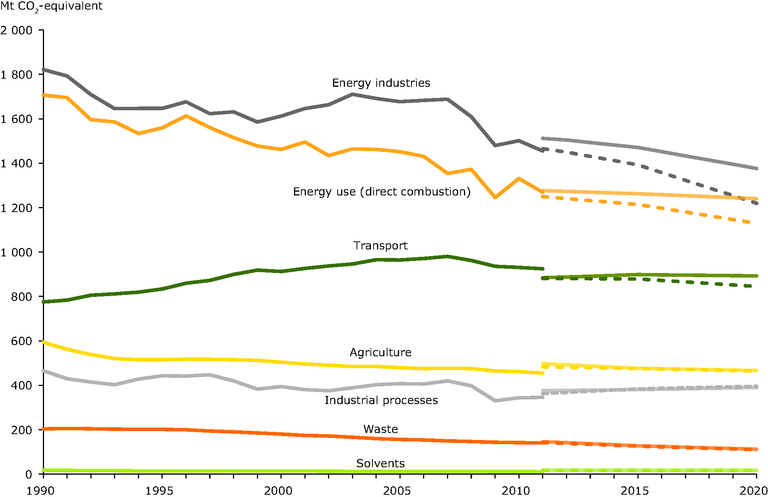
See all EU institutions and bodiesSolid lines represent historic emissions up to 2011 and WEM projections from 2011 onwards. Dashed lines represent WAM projections.
The gaps observed between the end of historic trends and the start of projected trends are due to the fact that absolute projection data were not calibrated on the latest 2011 GHG proxy inventory data.
Loading

