All official European Union website addresses are in the europa.eu domain.
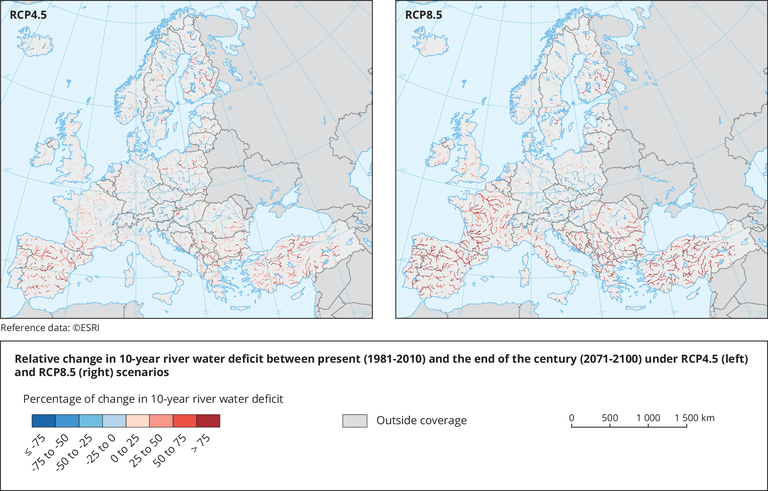
See all EU institutions and bodiesThese maps show the relative change in 10-year river water deficit under the 95th percentile for two scenarios of greenhouse gas emissions (RCP4.5 and RCP8.5).
Loading

