All official European Union website addresses are in the europa.eu domain.
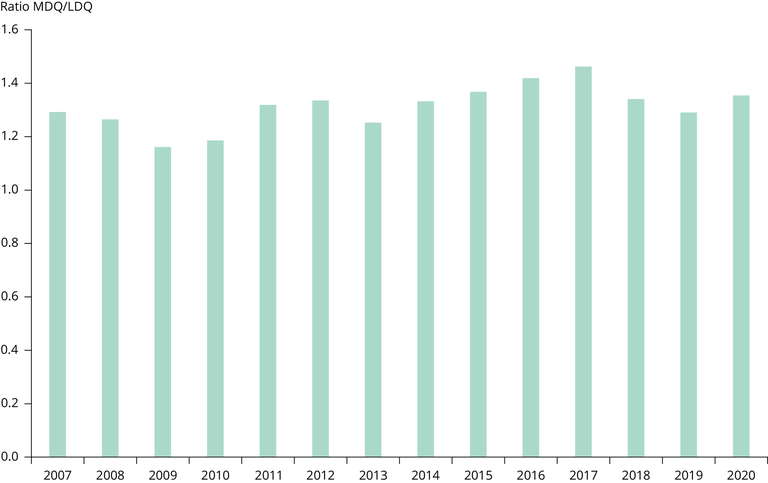
See all EU institutions and bodiesThe graph shows the ratio of the annual average population weighted concentration of PM₂.₅ in the poorest quintile divided by that of the richest quintile of NUTS3 regions in the EU, as measured by Gross Domestic Product (GDP) per capita at purchasing power standard, per year.
Loading

