All official European Union website addresses are in the europa.eu domain.
See all EU institutions and bodies
An official website of the European Union | How do you know?
Environmental information systems
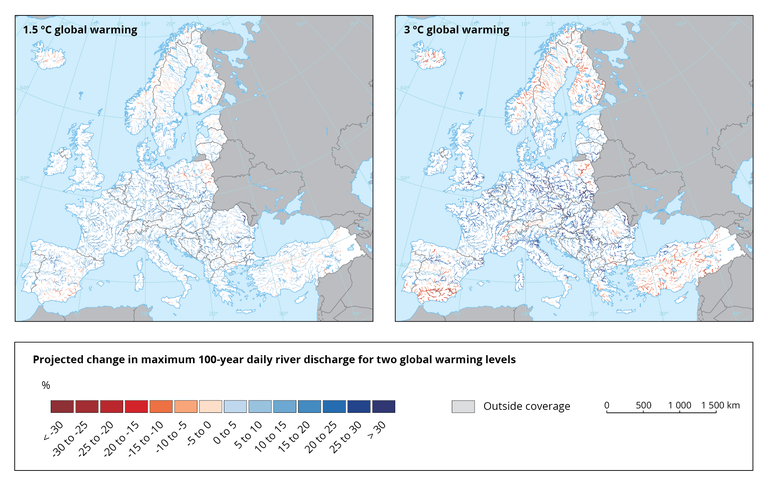
These maps show the relative change in maximum 100-year daily river discharge for two scenarios of global warming(1.5 °C and 3 °C)
Loading