All official European Union website addresses are in the europa.eu domain.
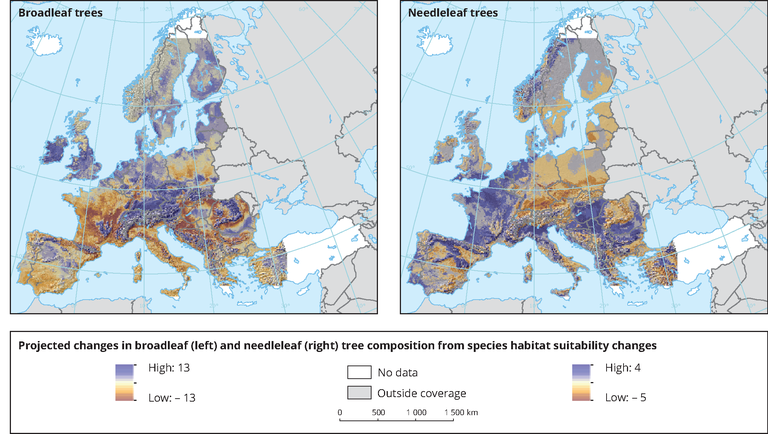
See all EU institutions and bodiesThe two panels indicate to what degree broadleaf (left panel) and needleleaf (right panel) tree species are expected to increase (blue) or decrease (brown) in numbers. The results represent species distribution modelling, using climate projections from six regional climate models using the A1B scenario of future emissions.
Loading

