All official European Union website addresses are in the europa.eu domain.
See all EU institutions and bodies
An official website of the European Union | How do you know?
Environmental information systems
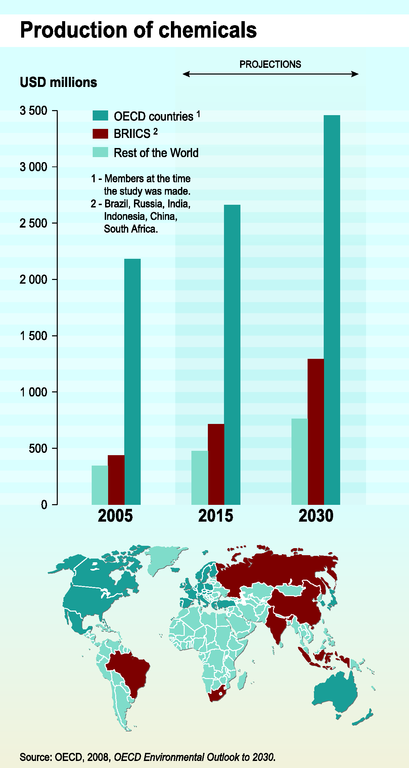
The bar graphic compares current (2005) and projected (2015 and 2030) chemicals production for 3 world regions in USD. The map precise the regions considered: OECD countries (darker blue), BRIICS countries (red), and rest of the world (pale blue).
Loading