All official European Union website addresses are in the europa.eu domain.
See all EU institutions and bodies
An official website of the European Union | How do you know?
Environmental information systems
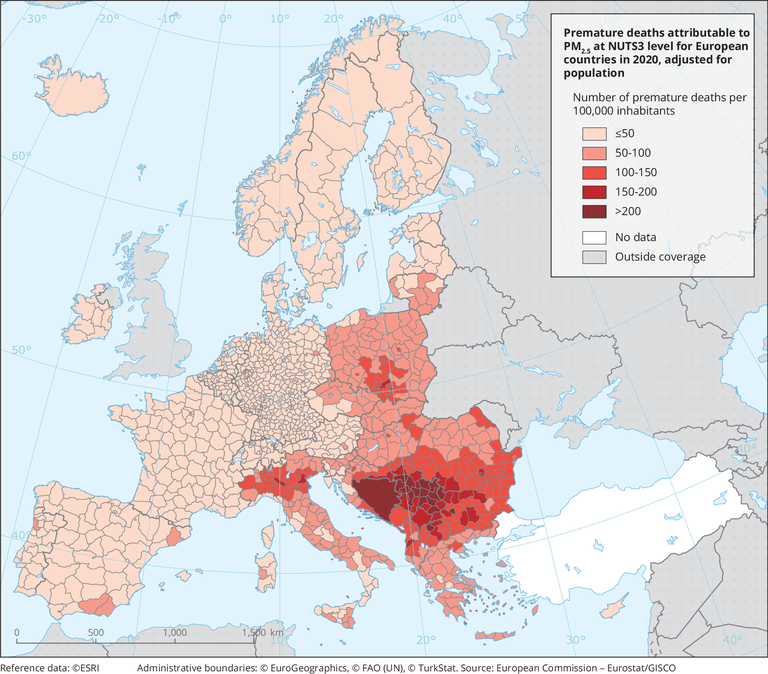
The map shows the number of premature deaths (PDs) attributed to PM2.5 in 2020 at NUTS3 level for European countries. The PDs, which in absolute terms are higher for those NUTS3 level regions with the highest populations, have been normalised by 100,000 inhabitants, to make the numbers comparable among regions. For countries where NUTS3 regions are not available, the national value is shown.
Loading