All official European Union website addresses are in the europa.eu domain.
See all EU institutions and bodies
An official website of the European Union | How do you know?
Environmental information systems
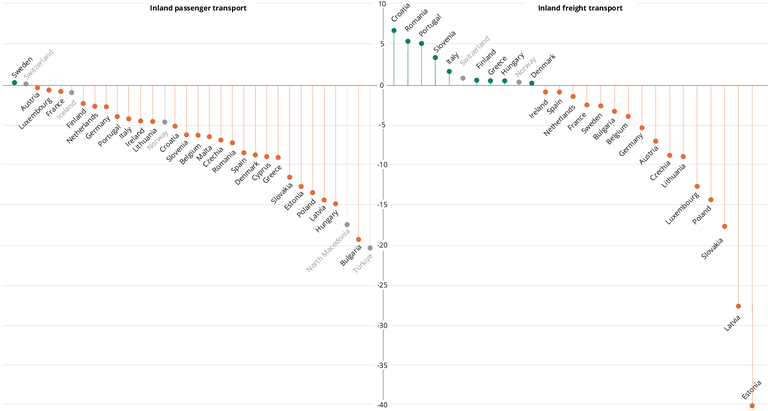
The figure shows the change, in percentage points, in the contribution of buses and trains (collective transport modes) to total inland passenger transport (left panel) and inland waterways and trains (non-road modes) to total freight transport (right panel) by country for the period 2005-2020.
Loading