All official European Union website addresses are in the europa.eu domain.
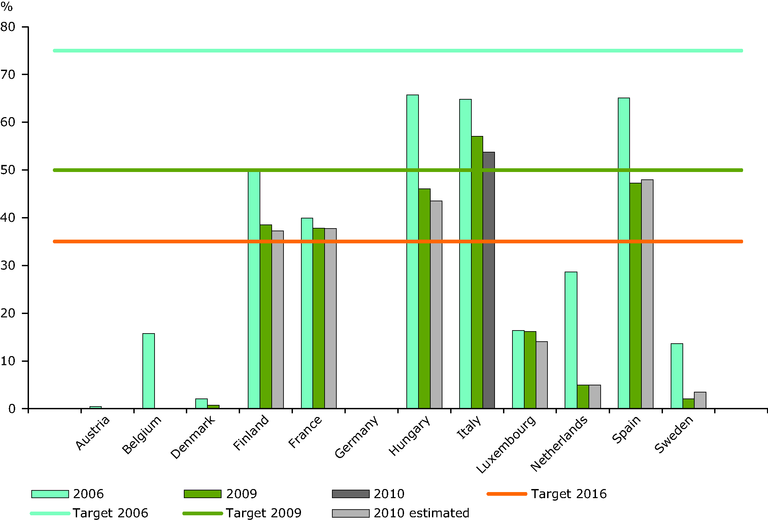
See all EU institutions and bodiesPercentage of biodegradable municipal waste landfilled in 2006, 2009 and 2010 compared with the amount generated in 1995 — countries without derogation periods
Chart (static)
Percentage of biodegradable municipal waste landfilled in 2006, 2009 and 2010 compared with the amount generated in 1995 — countries without derogation periods

- Member States’ reporting to the Commission according to the Landfill Directive (1999/31/EC)
- Municipality waste management in Italy (Rapporto Rifiuti Urbani 2012 — Italiano - Ispra)
- Austria
- Belgium
- Denmark
- Europe
- Finland
- France
- Germany
- Hungary
- Italy
- Luxembourg
- Netherlands
- Spain
- Sweden
Methodology
2006 and 2009 data are calculated by dividing the reported amount of landfilled biodegradable waste by the reported amount of biodegradable waste generated in 1995 (using data reported by the respective countries to the European Commission). The 2010 data are estimated for all countries but Italy. The ETC/SCP has estimated the missing BMW data for 2010 by subtracting the increase in the amount of MSW composted or digested from 2009 to 2010 (Eurostat, 2010) from the amounts of BMW landfilled in 2009. This calculation methodology did not address improvements in diverting other biodegradable waste from landfill, such as paper or textiles, or diversion from landfill to incineration. As such, these data are only rough estimates.
