All official European Union website addresses are in the europa.eu domain.
See all EU institutions and bodies
An official website of the European Union | How do you know?
Environmental information systems
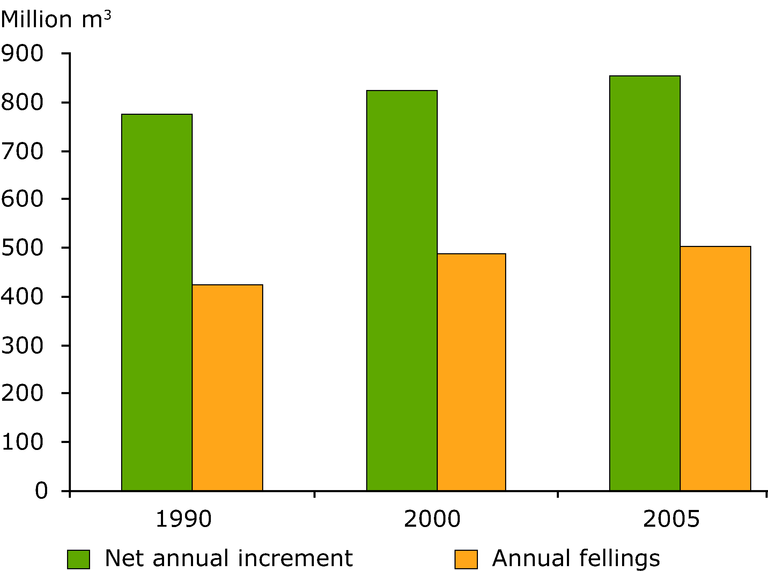
This graph shows the overall development of net annual increment in growing stock and annual fellings of forest available for wood supply in 1990-2005 in the 32 EEA member countries
Loading