All official European Union website addresses are in the europa.eu domain.
See all EU institutions and bodies
An official website of the European Union | How do you know?
Environmental information systems
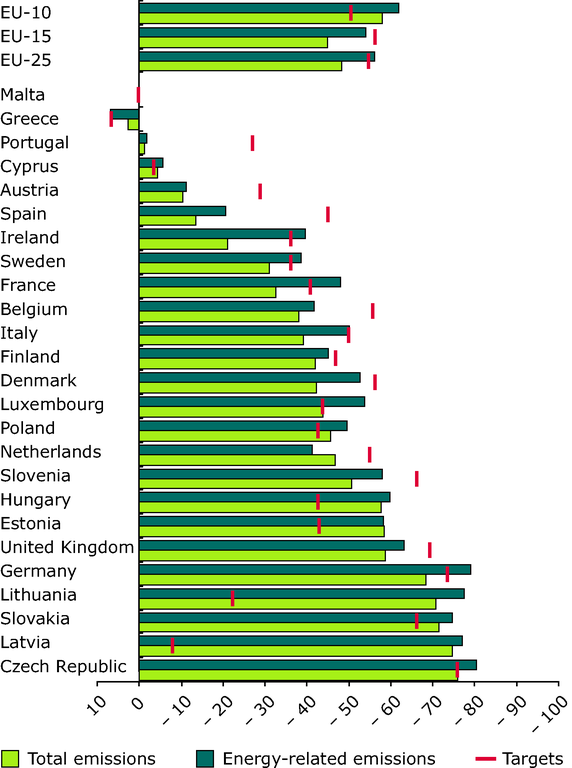
The graph shows the emissions of acidifying pollutants (SO2, NOX and NH3) each weighted by an acid equivalency factor prior to aggregation to represent their respective acidification potentials
Loading