All official European Union website addresses are in the europa.eu domain.
See all EU institutions and bodies
An official website of the European Union | How do you know?
Environmental information systems
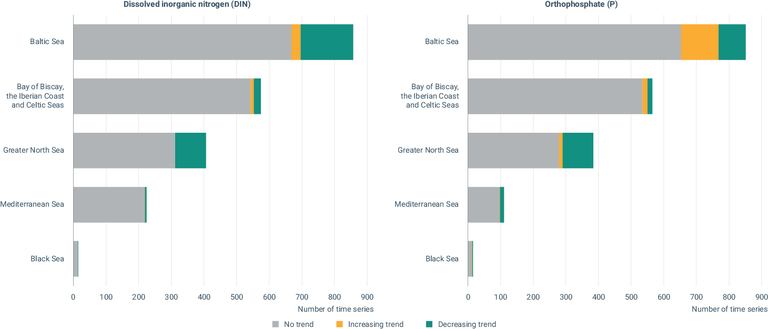
Number of time series available showing increasing, decreasing or no trends in dissolved inorganic nitrogen and orthophosphate concentrations for each regional sea during the period 2017-2021
Chart (static)
The different sea regions are presented in the Y axis. The X axis corresponds to the number of time series with statistically significant decreasing trends (green), increasing trends (orange) and no trends (grey). Statistical significance at p<0.05.
Downloads
Data sources
Metadata
More info
Loading
- Waterbase - Water Quality ICM, 2022
- Oceanographic database
- Chemistry data - Data & products on marine water quality
- Baltic Sea
- Bay of Biscay
- Black Sea
- Celtic Seas
- Greater North Sea
- Iberian Coast
- Macaronesia
- Mediterranean Sea
- North-East Atlantic Ocean
1980-2021
Methodology
Using as a base the dataset produced for the MAR005 CSI023 SEBI015 Nutrients in transitional coastal and marine waters_2022 Indicator, the number of locations with significant decreasing trends (green), increasing trends (orange) and no trends (grey) was counted for sea regions and all EU and these values were plotted in a bar-type chart.
Additional information
. North-East Atlantic Ocean and Macaronesia are not presented since data were not available for this indicator.
. Trends in concentrations of the nutrients, nitrogen (dissolved inorganic nitrogen-DIN) and phosphorus (orthophosphate), in the upper 10m of the water column in European seas during the season of low phytoplankton growth (SLPG) are shown for the period 1980-2021.
. Green bars indicate stations with significant (p<0.05) decreasing trends; orange bars show stations with significant (p<0.05) increasing trends; and grey bars show stations with no significant trends.
. The temporal range specified is the maximum range of dates for raw observations but this range varies upon the availability of observations at each location.
. DIN refers to the sum of ammonium, nitrite and nitrate concentrations, although in many samples not all three forms of nitrogen were measured.
. Data were aggregated into squares with sides of squares with sides of 1,375km for coastal stations within 20km from the coastline (m=80) and 5.5km for open water station more than 20km away from the coastline (m=20). A masking of 5km inwards from the coast was also applied.
. SLPG was considered for the winter months: January–March for stations within Baltic Sea and east of 15 E and January–February was used for all other stations.
. Temporal trends were estimated with the non-parametric Mann-Kendall test. Only stations having data of at least 5 years and having at least data in the last 5-year period (2017-2021) were considered. A p-value < 0.05 was used to consider a statistically significant trend.