All official European Union website addresses are in the europa.eu domain.
See all EU institutions and bodies
An official website of the European Union | How do you know?
Environmental information systems
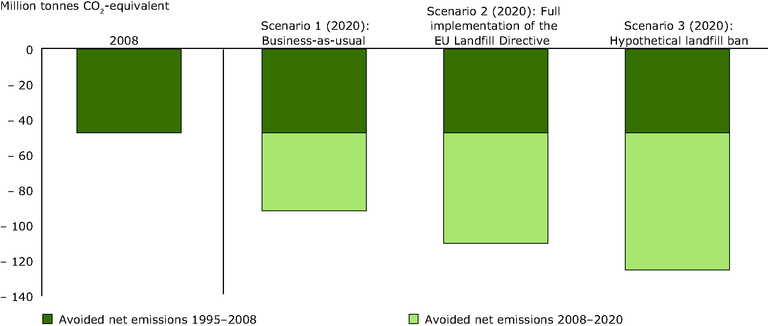
The figure illustrates the net emission reduction achieved in the period 1995-2008 (in the first column) and the net GHG emission reductions in 2020 compared to 1995 for all three scenarios (in columns two, three and four). The net emission reduction is calculated as the difference between net emissions in 1995 and net emissions in 2008 or 2020, as appropriate.
Loading