All official European Union website addresses are in the europa.eu domain.
See all EU institutions and bodies
An official website of the European Union | How do you know?
Environmental information systems
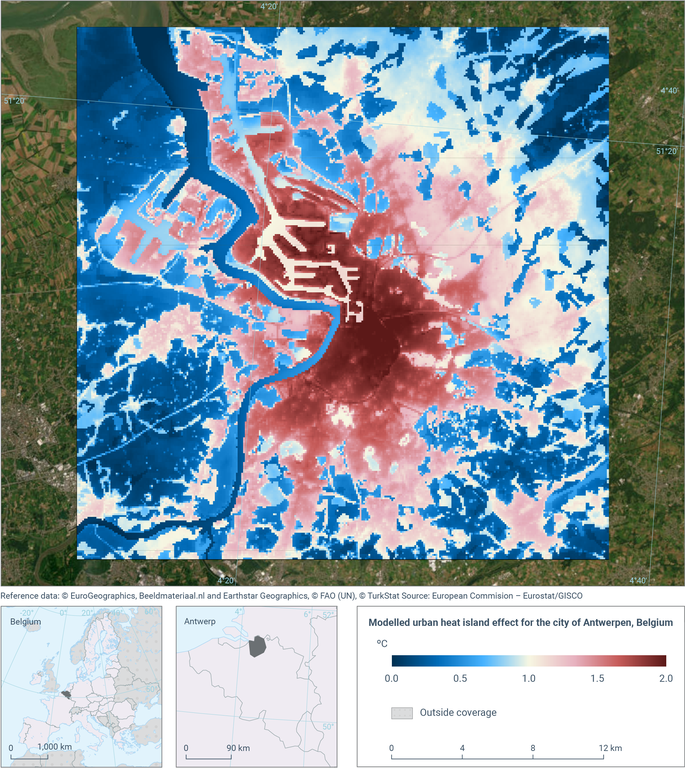
The map shows the difference in 10-year average temperature at 2m height (2008-2017) for the urban centre of Antwerpen, as compared to its surrounding area, modelled by the UrbClim model within the framework of the Copernicus Health Service.
Loading