All official European Union website addresses are in the europa.eu domain.
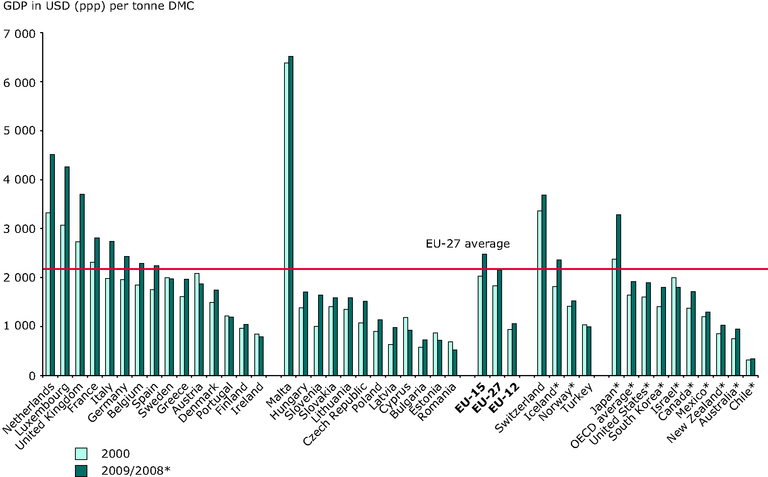
See all EU institutions and bodiesThis figure shows the material productivity (GDP in millions of 2011 US$ (converted to 2011 price level with updated 2005 EKS PPPs) per tonnes DMC) for the EU27 member states and selected other countries in 2000 and 2009 respectively 2008.
Loading

