All official European Union website addresses are in the europa.eu domain.
See all EU institutions and bodies
An official website of the European Union | How do you know?
Environmental information systems
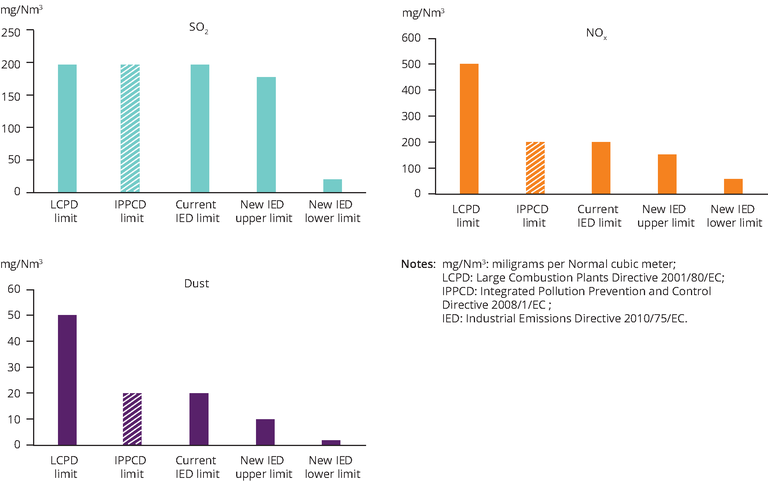
The three graphs show the progression of emission limits in EU industrial emission policy over time. The example chosen is that emission limits for SO2, NOx and dust from existing large coal fired power plants.
Loading