All official European Union website addresses are in the europa.eu domain.
See all EU institutions and bodies
An official website of the European Union | How do you know?
Environmental information systems
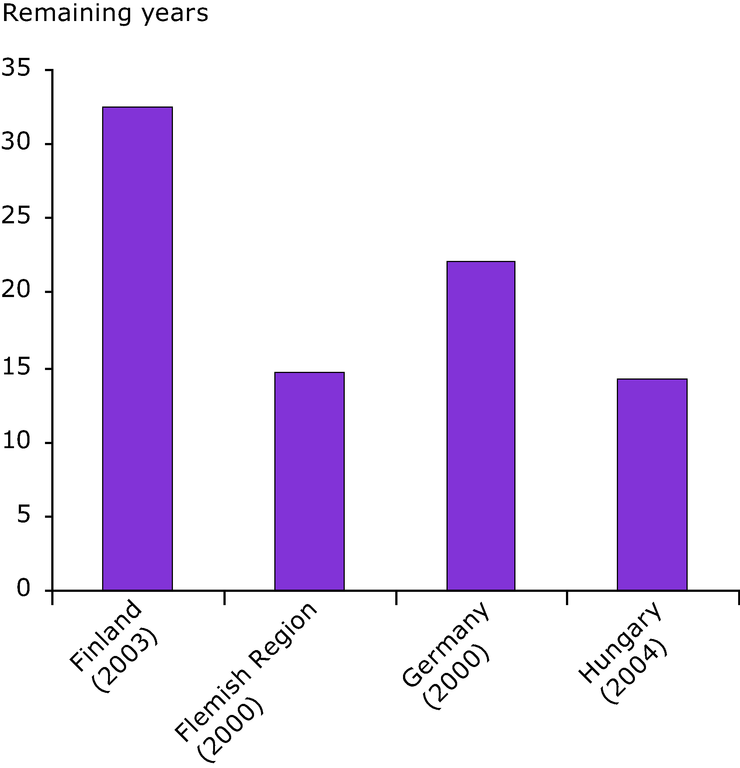
The graph shows how many years the country/region can continue to landfill municipal waste if the share of waste landfilled remains the same as in the year shown in brackets.
Loading