All official European Union website addresses are in the europa.eu domain.
See all EU institutions and bodies
An official website of the European Union | How do you know?
Environmental information systems
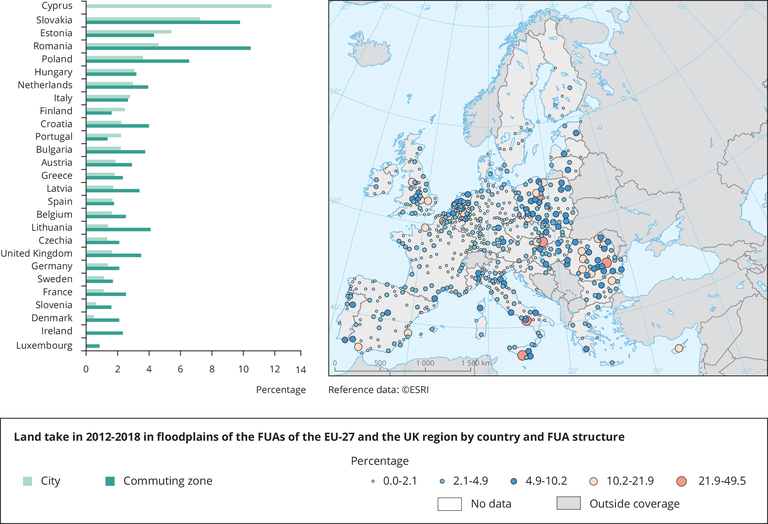
Left chart: The extent of land take during 2012-2018 (in % of the 2012 value) in floodplains of the FUAs is presented in the barchart, broken down by countries and protection type. The dataset covers the entire EEA-39 region but the figure only presents EU-27+UK countries.
Right map: Land take is derived from comparing the Urban Atlas 2012 and 2018 datasets of the Copernicus Land Monitoring Service. Land take is expressed as the converted area in % of the 2012 land cover extent (% of non-urban land cover in 2012 that is converted to urban land cover by 2018). The dataset covers the entire EEA-39 region but the Figure only presents EU-27+UK countries.
Loading