All official European Union website addresses are in the europa.eu domain.
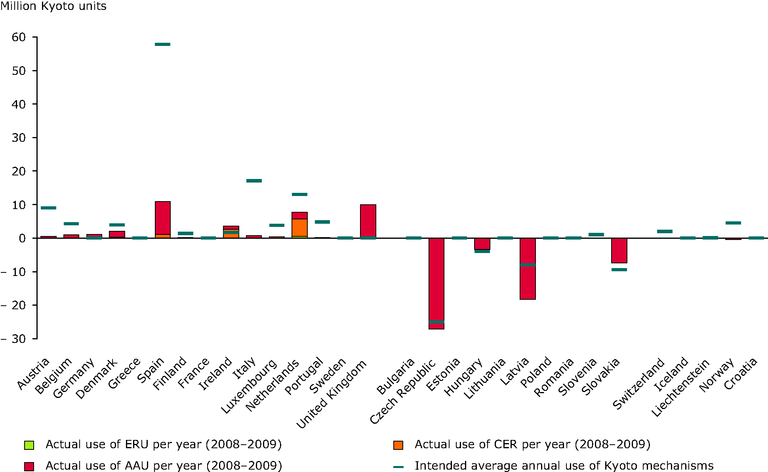
See all EU institutions and bodiesIntended (2008–2012) and actual (2008–2009) average annual use of the Kyoto mechanisms
Chart (static)

- Austria
- Belgium
- Bulgaria
- Czechia
- Denmark
- Estonia
- Finland
- France
- Germany
- Greece
- Hungary
- Iceland
- Ireland
- Italy
- Latvia
- Liechtenstein
- Lithuania
- Luxembourg
- Netherlands
- Norway
- Poland
- Portugal
- Romania
- Slovakia
- Slovenia
- Spain
- Sweden
- Switzerland
- United Kingdom
- A positive value indicates that the country has/intends to acquire the different types of Kyoto units. A negative value
indicates that a country has/intends to sell allowances.
- Actual use of Kyoto mechanisms is based on delivery of units according to the SEF table. Countries might have acquired
more units than are recorded in the SEF tables, e.g. due to delivery dates later in the commitment period. Due to the late
start of national and ETS registries in some countries, it was not possible to assess the actual delivery/sale of units in 2008.
Therefore the average delivery/sale of units for the years 2008 and 2009 was used. For the United Kingdom, SEF tables
include the over-seas territories and the crown dependencies of the United Kingdom. For the purposes of the implementation
of Article 4 of the Kyoto Protocol and as not they are not part of the EC, the over-seas territories and the crown dependencies
of the United Kingdom were excluded from the initial assigned amount of the United Kingdom under the EC. In consequence,
the trade of AAU is slightly overestimated for the United Kingdom, as SEF tables for the geographical coverage of the United
Kingdom under the EC only are not available.
