All official European Union website addresses are in the europa.eu domain.
See all EU institutions and bodies
An official website of the European Union | How do you know?
Environmental information systems
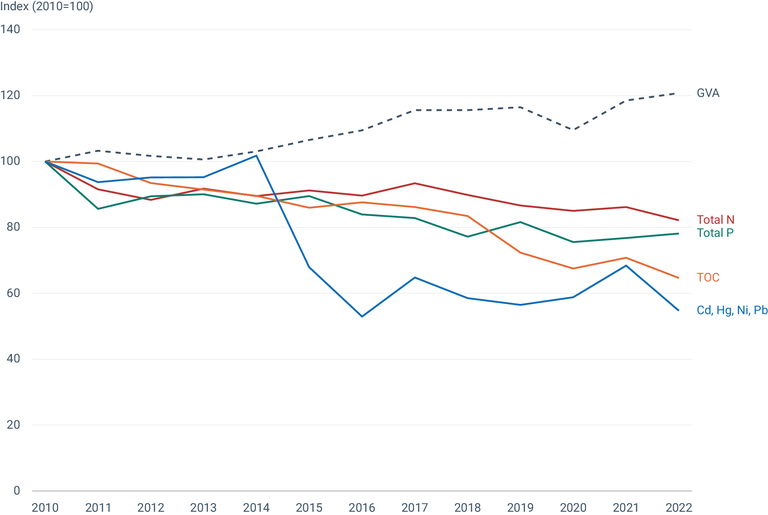
The figure shows the trend of pollutant releases into water in the EU-27 from 2010 to 2022 by using 2010 releases values as reference. In addition, gross value added (GVA) from the industry sector is presented.
Loading