All official European Union website addresses are in the europa.eu domain.
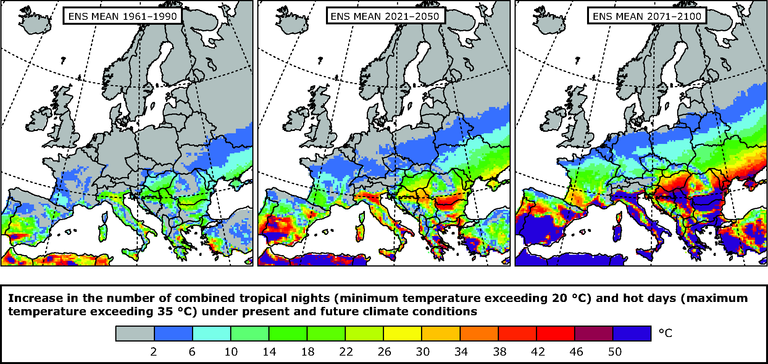
See all EU institutions and bodiesThe map is the result of climatic modelling and represents the number of combined tropical nights (T>20°C) and hot days (T>35°C) for the period 2071 to 2100
Loading

