All official European Union website addresses are in the europa.eu domain.
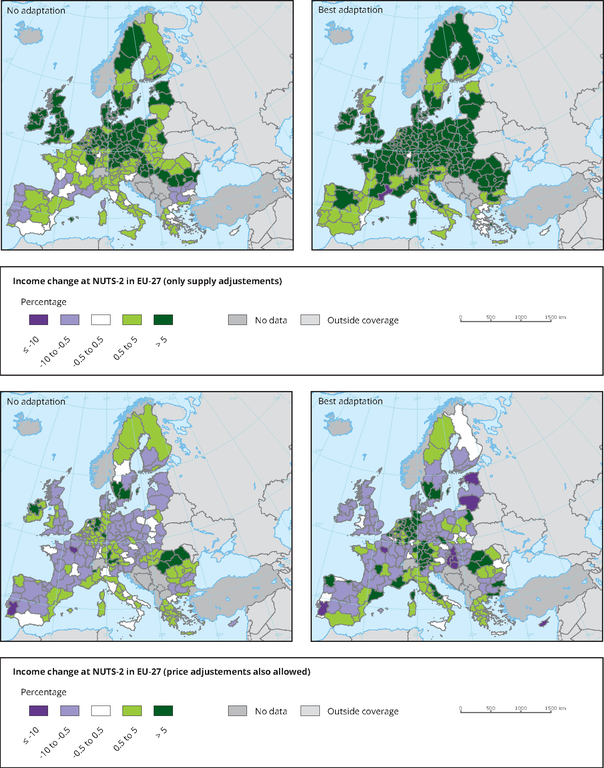
See all EU institutions and bodiesThe figure presents simulated changes in agricultural income in the EU under a climate change scenario. The simulated changes are derived for year 2020, presented on the map in relative terms (percentage change) compared to a base year in 2004. The climate change scenario is divided into sub-scenarios (i) taking into account supply and market price adjustments of the EU agricultural sector and (ii) taking into account technical adaptation of crops to climate change. The colour indices in the maps represent the scale of the impact and are labelled in the figure.
Loading

