All official European Union website addresses are in the europa.eu domain.
See all EU institutions and bodiesAn official website of the European Union | How do you know?
Environmental information systems
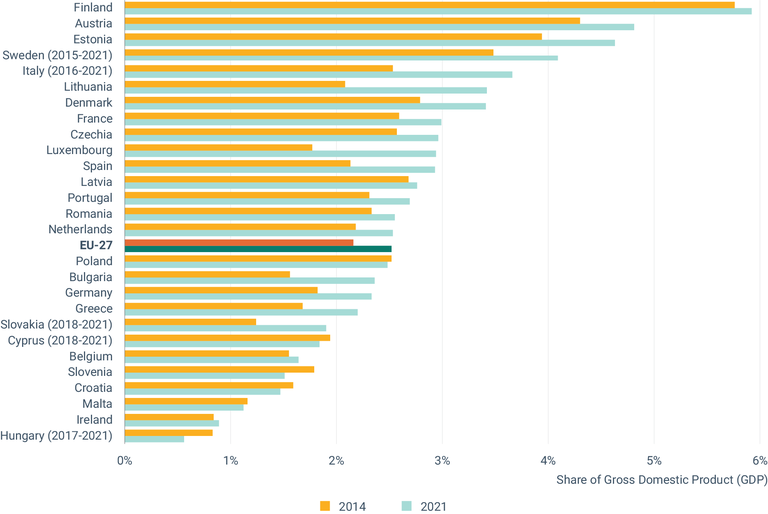
Gross value added of the environmental goods and services sector as a share of gross domestic product, by EU Member States, 2014 and 2021
Chart (static)

Downloads
Data sources
Metadata
More info
Loading
- Production, value added and exports in the environmental goods and services sector [ENV_AC_EGSS2__custom_10778178]
- Austria
- Belgium
- Bulgaria
- Croatia
- Cyprus
- Czechia
- Denmark
- Estonia
- Finland
- France
- Germany
- Greece
- Hungary
- Ireland
- Italy
- Latvia
- Lithuania
- Luxembourg
- Malta
- Netherlands
- Poland
- Portugal
- Romania
- Slovakia
- Slovenia
- Spain
- Sweden
2014
2021
Methodology
This indicator is directly based on data published by Eurostat, and the underpinning methodology can be found in Eurostat (2023). EU-level data are based on Eurostat estimates. A detailed discussion of statistics on the environmental goods and services sector can be found in Eurostat (2016).
The data were deflated to 2010 prices by using the implicit GDP deflator series (indexed to 2010) published by Eurostat.
