All official European Union website addresses are in the europa.eu domain.
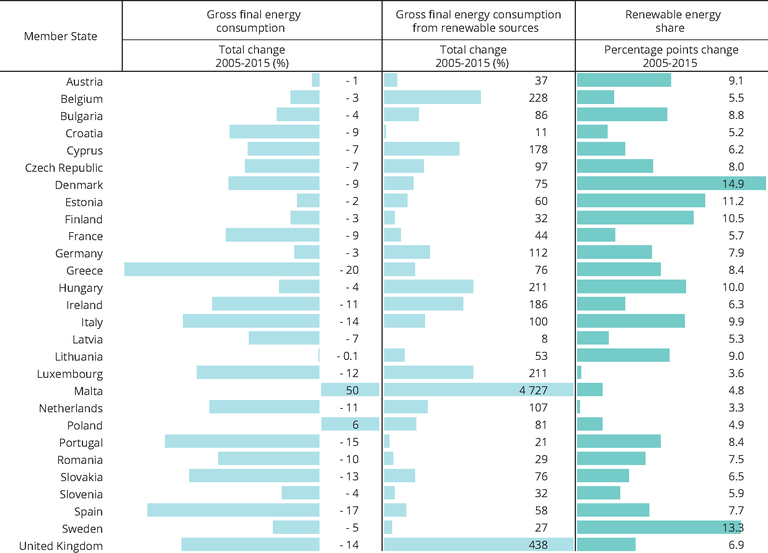
See all EU institutions and bodiesGross final energy consumption (total and from renewable sources) and shares of energy from renewable sources in Member States, 2005-2015
Chart (static)
The bar chart shows the change in gross final energy consumption (both total and from renewables sources) and renewable energy share for the EU Member States.

- Share of renewable energy in cross final energy consumption
- Final energy consumption by sector
- Austria
- Belgium
- Bulgaria
- Croatia
- Cyprus
- Czechia
- Denmark
- Estonia
- Finland
- France
- Germany
- Greece
- Hungary
- Ireland
- Italy
- Latvia
- Lithuania
- Luxembourg
- Malta
- Netherlands
- Poland
- Portugal
- Romania
- Slovakia
- Slovenia
- Spain
- Sweden
- United Kingdom
Methodology
Based on:
• Renewable energy data from Eurostat, reported by MS under the Energy Statistics Regulation (EC) No 1099/2008 and the Renewable Energy Directive (2009/28/EC) and published in the SHARES - Short Assessment of Renewable Energy Sources tool.
• Final energy consumption data from Eurostat, reported by MS under the Energy Statistics Regulation (EC) No 1099/2008 and published in the energy statistics database.
Units
Total change of gross final energy consumption (%), Total change of gross final energy consumption from renewable energy (%), Percentage points change of renewable energy shares
Additional information
In Malta there was an increase in gross final energy consumption from renewable sources of + 4 727 % between 2005 and 2015. Because of ts absolute small size, however, data may not be fully representative and are thus not represented above.
The data on total gross final energy consumption take into account adjustments with regard to the amounts of energy consumed in aviation, as stipulated under the RED.
