All official European Union website addresses are in the europa.eu domain.
See all EU institutions and bodies
An official website of the European Union | How do you know?
Environmental information systems
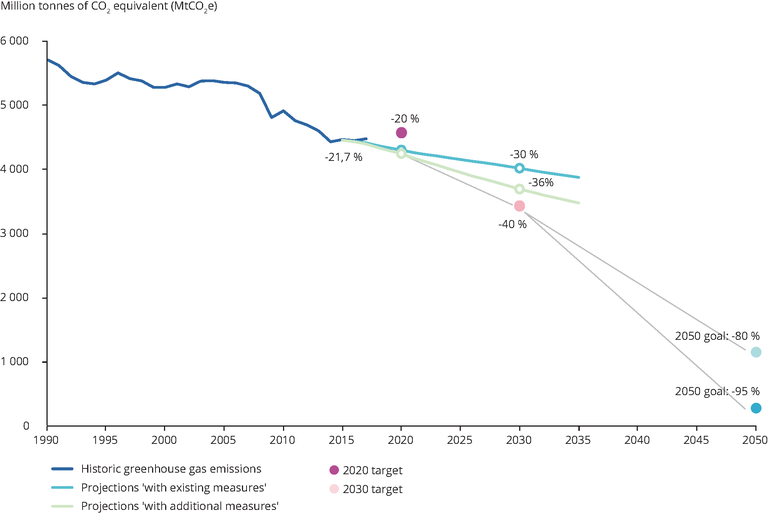
Historic trends from 1990 to 2017 are represented in solid lines. Projections until 2035 are represented in dashed lines. The upper line represents the scenario "with existing measures", while the lower line represents the scenario "with additional measures". EU targets and objectives for 2020, 2030 and 2050 are represented as bullets.
Loading