All official European Union website addresses are in the europa.eu domain.
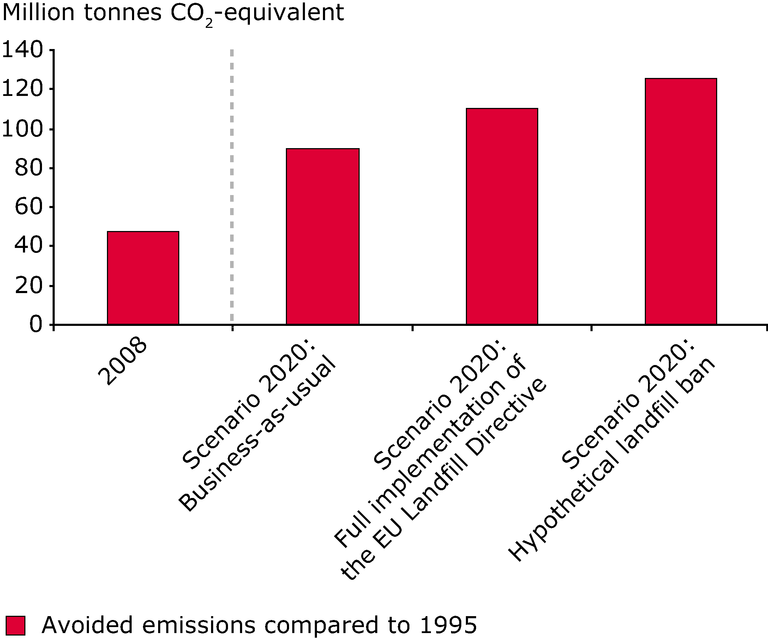
See all EU institutions and bodiesThis figure shows avoided net emissions of greenhouse gases from the waste management sector in EU-27 (minus Cyprus), Norway and Switzerland. More detailed, the figure shows the difference in the net emissions in years 2008 and 2020 scenarios to the base year’s (1995) net emissions
Loading

