All official European Union website addresses are in the europa.eu domain.
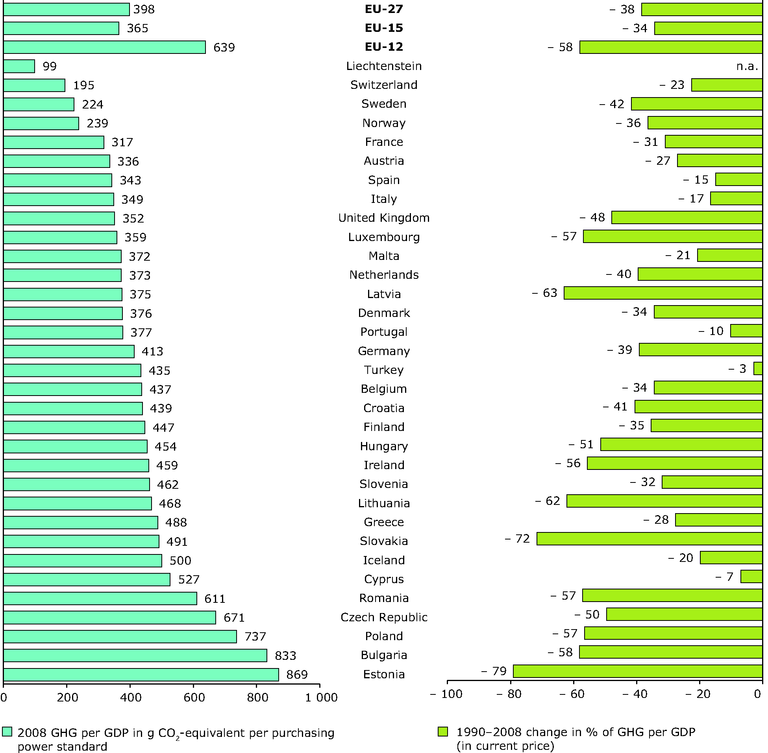
See all EU institutions and bodiesThe left graph uses GDP at market prices, current prices, converted to PPS (purchasing power standard), which allows meaningful volume comparisons of GDP across European countries and benchmark country performance in a particular year. The right graph refers to GDP at constant market prices, which allows consistent GDP time series in a particular country.
Loading

