All official European Union website addresses are in the europa.eu domain.
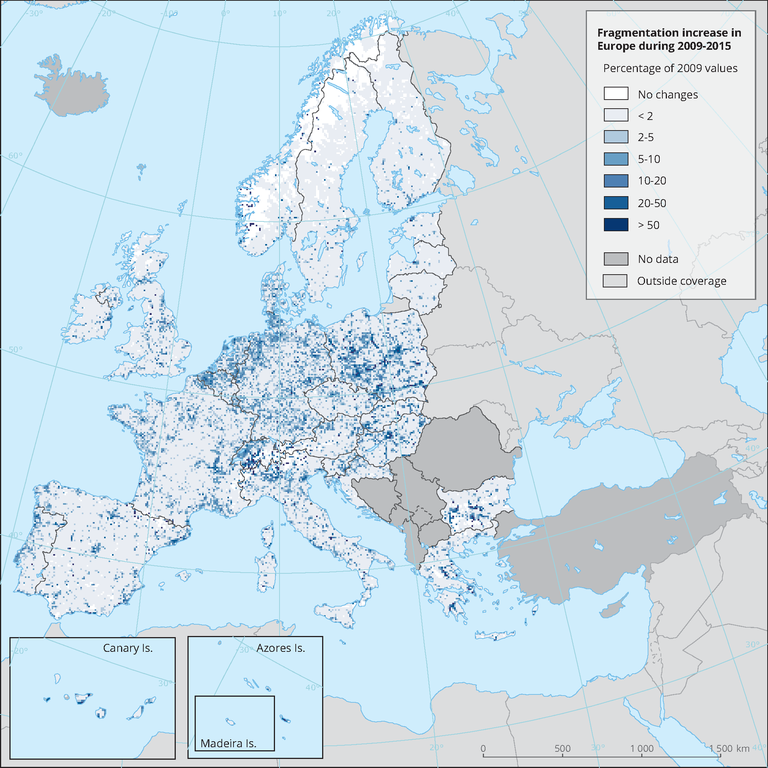
See all EU institutions and bodiesThe map shows the difference of the years 2015 and 2009 and presents the increase in fragmentation in that period. The original 100m values were resampled to a 5 km grid for visualisation purposes.
Loading

