All official European Union website addresses are in the europa.eu domain.
See all EU institutions and bodies
An official website of the European Union | How do you know?
Environmental information systems
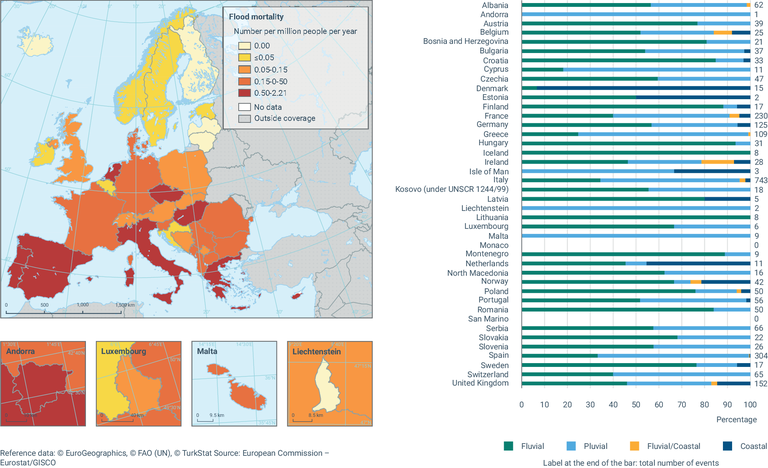
Flood events by type and mortality per year
Map (static)
Downloads
Data sources
Metadata
More info
Loading
- HANZE database of historical flood impacts in Europe, 1870-2020
- Albania
- Austria
- Belgium
- Bosnia and Herzegovina
- Bulgaria
- Croatia
- Cyprus
- Czechia
- Denmark
- Estonia
- Finland
- France
- Germany
- Greece
- Hungary
- Iceland
- Ireland
- Italy
- Kosovo
- Latvia
- Liechtenstein
- Lithuania
- Luxembourg
- Malta
- Montenegro
- Netherlands
- North Macedonia
- Norway
- Poland
- Portugal
- Romania
- Serbia
- Slovakia
- Slovenia
- Spain
- Sweden
- Switzerland
- Türkiye
1870-2020
Methodology
The number of floods and fatalities are taken directly from HANZE database, which is a multisource dataset of flood impacts and flood exposure. The mortaility rate was computed by dividing the flood fatalities in a given year and country by the total population in the same year and country. The population data was also taken from HANZE, but interpolated between available timesteps where necessary. The underlying impact data are described in Paprotny, D., Terefenko, P., and Śledziowski, J.: HANZE v2.1: an improved database of flood impacts in Europe from 1870 to 2020, Earth Syst. Sci. Data, 16, 5145-5170, https://doi.org/10.5194/essd-16-5145-2024, and available on Zenodo (https://zenodo.org/records/8410025). The population data is described in Paprotny, D., Mengel, M.: Population, land use and economic exposure estimates for Europe at 100 m resolution from 1870 to 2020, Sci. Data 10, 372, https://doi.org/10.1038/s41597-023-02282-0, 2023, and available on Zenodo (https://zenodo.org/records/6783023).