All official European Union website addresses are in the europa.eu domain.
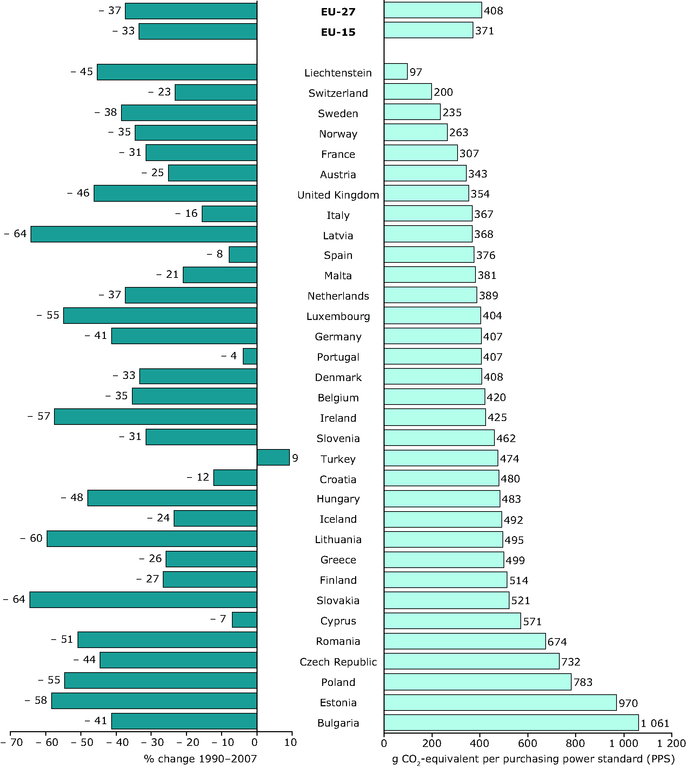
See all EU institutions and bodiesRelative economic intensity of greenhouse gas emissions in Europe in 2007 (index EU‑27 = 100) and change in the economic intensity of greenhouse gas emissions in Europe, 1990–2007
Chart (static)
Relative economic intensity of greenhouse gas emissions in Europe in 2007 (index EU‑27 = 100) and change in the economic intensity of greenhouse gas emissions in Europe, 1990–2007

- Austria
- Belgium
- Bulgaria
- Cyprus
- Czechia
- Denmark
- Estonia
- Finland
- France
- Germany
- Greece
- Hungary
- Ireland
- Italy
- Latvia
- Lithuania
- Luxembourg
- Malta
- Netherlands
- Poland
- Portugal
- Romania
- Slovakia
- Slovenia
- Spain
- Sweden
- United Kingdom
The chart on the left shows the greenhouse gas economic intensity (i.e. greenhouse gases divided by GDP) for each country in 2007 relative to the EU-27. GDP here is measured in purchasing power standards (PPS). PPS in Liechtenstein were estimated from the purchasing power of the Swiss franc, using Eurostat national accounts, and estimates of GDP at current prices from the UN millennium indicators.In the chart on the right, the starting year for the calculation of the change in the economic intensities of greenhouse gas emissions was 1990. Because of lack of GDP data, few exceptions apply: Estonia (1993), Slovak Republic (1992), Malta, Bulgaria and Hungary (1991), Croatia (1995). To be consistent, the reference year for greenhouse gas emissions in these countries is the same as for GDP.
