All official European Union website addresses are in the europa.eu domain.
Chart (static)Published 27 Feb 2023Modified 22 Oct 2024
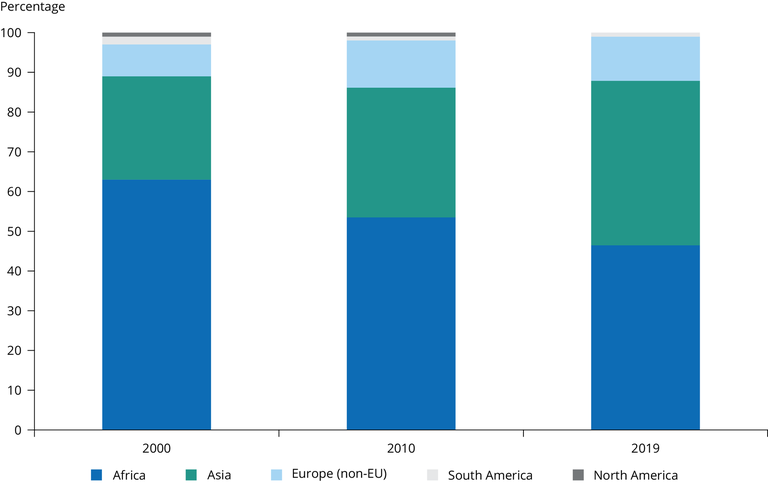
Groupings of countries are based on those of the United Nations Statistical Office (UN Statistics Division, 2022).
Percentage