All official European Union website addresses are in the europa.eu domain.
See all EU institutions and bodies
An official website of the European Union | How do you know?
Environmental information systems
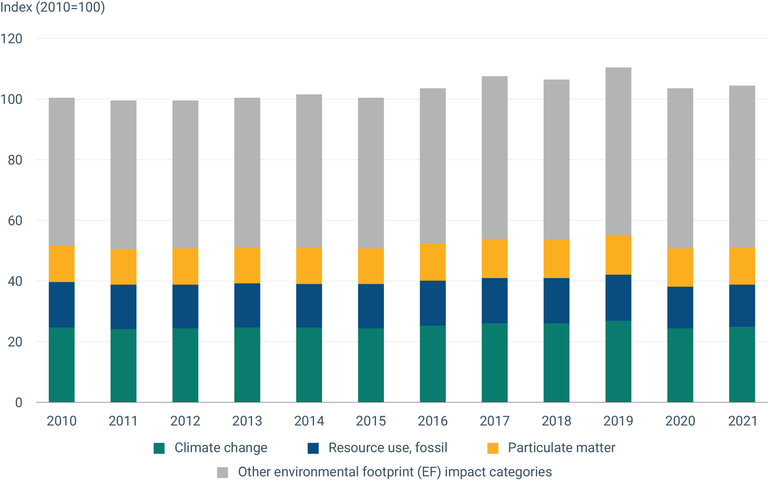
The figure shows the weighted impacts from the entire EU consumption over time, indexed to 2010.
The EU consumption footprint is shown as a single indexed score (2010=100) and is broken down according to the impact categories of the Environmental Footprint (EF) method that make the most significant contribution to the consumption footprint - ‘climate change’, ‘resource use, fossil’ and ‘particulate matter’ - and other EF impact categories.
Loading