All official European Union website addresses are in the europa.eu domain.
See all EU institutions and bodies
An official website of the European Union | How do you know?
Environmental information systems
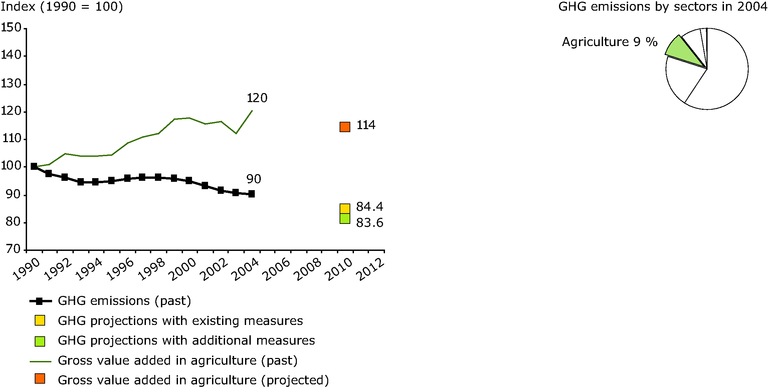
Left: This graph shows past (1990-2004) and projected (2010) emissions due to agriculture, and compares them with gross value added in agriculture
Loading