All official European Union website addresses are in the europa.eu domain.
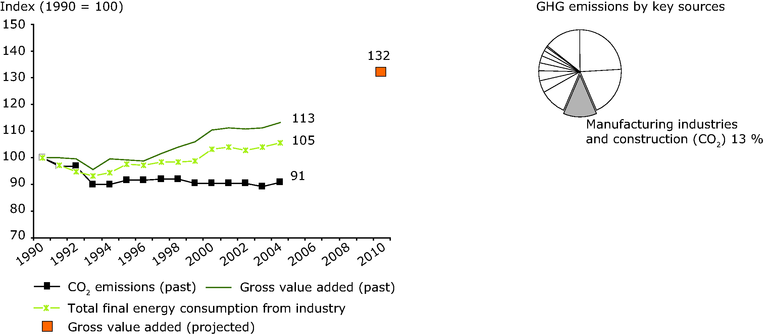
See all EU institutions and bodiesLeft: This graph shows past (1990-2004) and projected (2010) emissions due to energy use from manufacturing and construction industries and compares them with value added and energy use from these sectors
Right: This graph represents the share of CO2 emissions from energy use by the manufacturing industries and construction in total GHG emissions in the EU-15, in 2004
Loading

