All official European Union website addresses are in the europa.eu domain.
See all EU institutions and bodies
An official website of the European Union | How do you know?
Environmental information systems
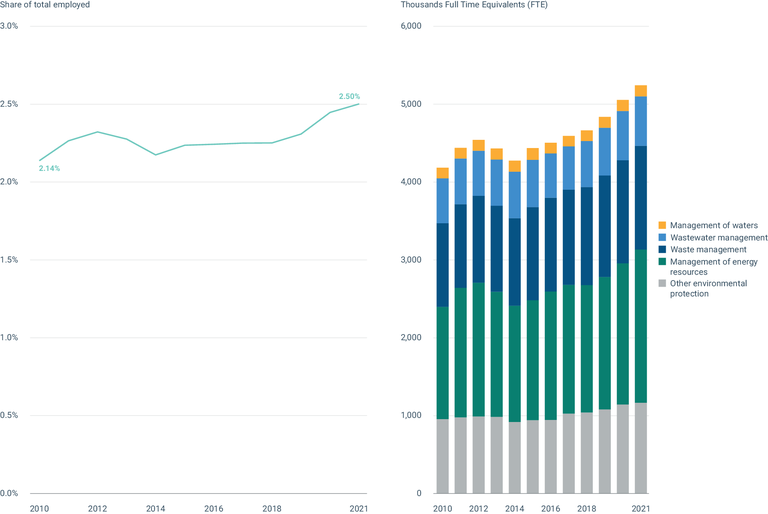
The figure shows employment in the environmental goods and services sector for the EU-27, split based on the largest classifications, along with what share of total employment this represents. Data is shown for 2010-2021.
Loading