All official European Union website addresses are in the europa.eu domain.
See all EU institutions and bodiesAn official website of the European Union | How do you know?
Environmental information systems
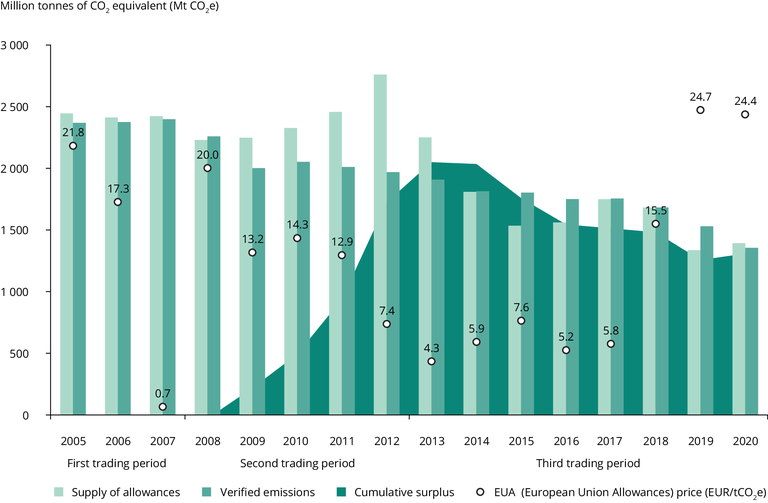
Emissions, allowances, surplus and prices in the EU ETS, 2005-2020
Chart (static)

The cumulative surplus represents the difference between allowances allocated for free, auctioned or sold plus international credits surrendered or exchanged from 2008 to date minus the cumulative emissions. It also accounts for net demand from aviation during the same period.
Downloads
Data sources
Metadata
More info
Loading
- EUA UK Auctions
- Emission Spot Primary Market Auction Report 2020
- Austria
- Belgium
- Bulgaria
- Cyprus
- Czechia
- Denmark
- Estonia
- Finland
- France
- Germany
- Greece
- Hungary
- Iceland
- Ireland
- Italy
- Latvia
- Liechtenstein
- Lithuania
- Luxembourg
- Malta
- Netherlands
- Norway
- Poland
- Portugal
- Romania
- Slovakia
- Slovenia
- Spain
- Sweden
- United Kingdom
2005-2020
Additional information
Note: The cumulative surplus represents the difference between allowances allocated for free, auctioned or sold plus international credits surrendered or exchanged from 2008 to date minus the cumulative emissions. It also accounts for net demand from aviation during the same time period.
UK allowances for 2019 were auctioned in 2020 instead.
