All official European Union website addresses are in the europa.eu domain.
See all EU institutions and bodies
An official website of the European Union | How do you know?
Environmental information systems
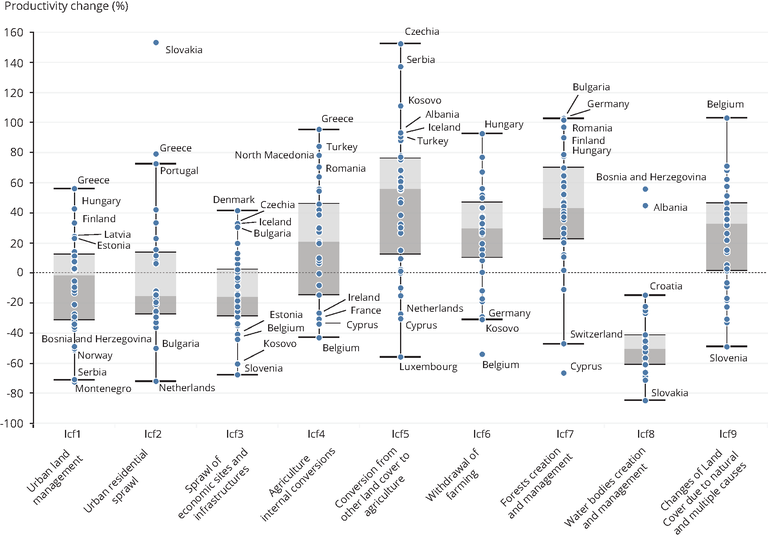
The chart shows the vegetation productivity changes (%) over areas with land use change in the period 2000-2018. The values are broken down by major land use change drivers.
Loading