All official European Union website addresses are in the europa.eu domain.
See all EU institutions and bodiesAn official website of the European Union | How do you know?
Environmental information systems
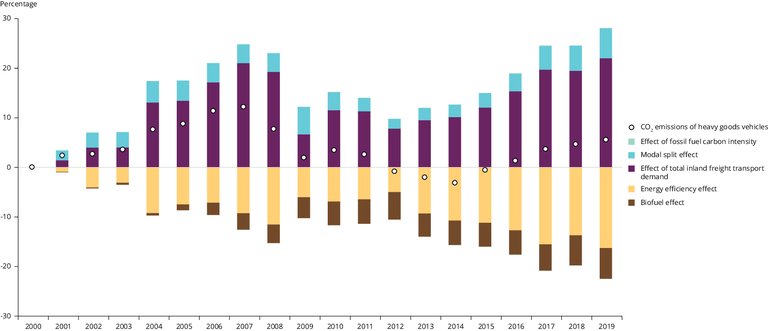
Decomposition analysis of the CO2 emissions from trucks in the EU-27, 2000-2019 — percentage contribution of various factors
Chart (static)

CO2 emissions: expressed as percentage change compared with the year 2000.
Driving factors: expressed as percentage contribution of driving factors to percentage change in CO2 emissions from trucks.
Downloads
Data sources
Metadata
More info
Loading
- Complete energy balances (nrg_bal_c)
- EU Reference Scenario 2020 (Dataset URL is not available)
- Austria
- Belgium
- Bulgaria
- Croatia
- Cyprus
- Czechia
- Denmark
- Estonia
- Finland
- France
- Germany
- Greece
- Hungary
- Ireland
- Italy
- Latvia
- Lithuania
- Luxembourg
- Malta
- Netherlands
- Poland
- Portugal
- Romania
- Slovakia
- Slovenia
- Spain
- Sweden
2000-2019
Methodology
- Decomposition analysis, using LDMI method
- The Greenhouse Gas (GHG) emissions inventory reports the total emissions of heavy-duty trucks together with the emissions of busses and coaches. Historical data for the years 2005, 2010 and 2015 that underpin the EU Reference Scenario 2020 were used to determine the share of Heavy Goods Vehicles (HGVs) in the energy consumption and emissions of Heavy-Duty Vehicles (HDVs). For the intermediate years the shares are interpolated. For the period before 2005 the share is taken to be the same as in 2005, and for the period after 2015 the share of 2015 is applied
Additional information
- Units are percentage contribution of driving factors to percentage change in CO₂ emissions from heavy goods vehicles
- The dataset "Greenhouse gas emission inventory" is in folder "EU_CRF_tables_EUA_2021_UNFCCC_2021.zip" of "Annual European Union greenhouse gas inventory 1990–2019 and inventory report 2021" report (https://www.eea.europa.eu/publications/annual-european-union-greenhouse-gas-inventory-2021)
