All official European Union website addresses are in the europa.eu domain.
See all EU institutions and bodies
An official website of the European Union | How do you know?
Environmental information systems
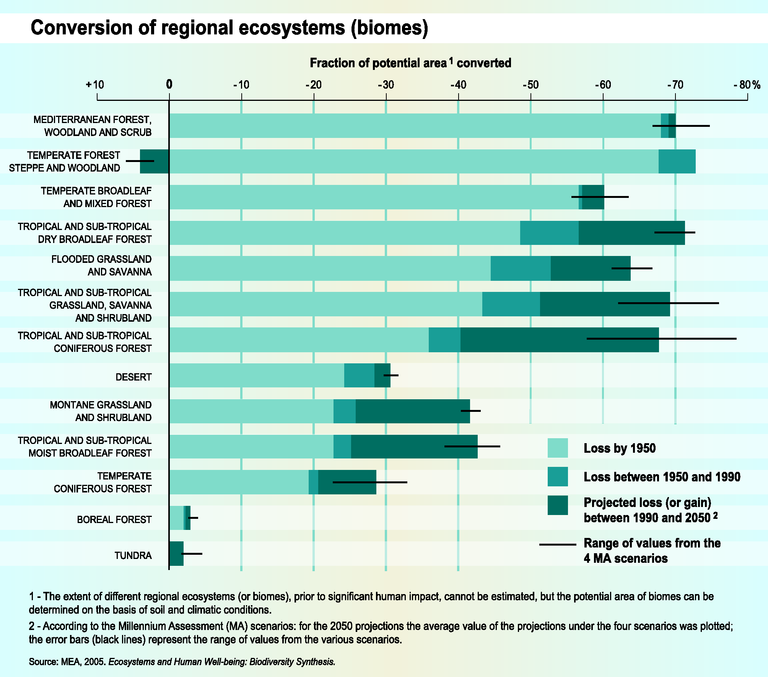
The bars show, for each biome, the fraction of potential area lost by 1950 (pale blue), lost between 1950 and 1990 (blue) and the projected loss by 2050 (dark blue).
Loading