All official European Union website addresses are in the europa.eu domain.
See all EU institutions and bodiesAn official website of the European Union | How do you know?
Environmental information systems
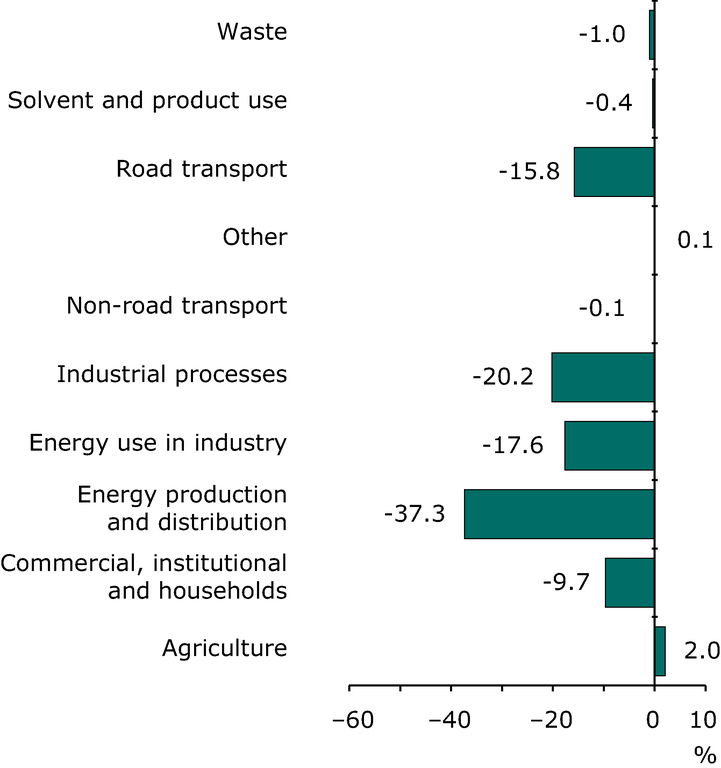
Contribution to total change in PM10 emissions for each sector and pollutant between 1990 and 2009 (EEA member countries)
Chart (static)
The contribution made by each sector to the total change in primary PM10 particulate matter emission between 1990 and 2009.

Downloads
Data sources
Metadata
More info
Loading
- Austria
- Belgium
- Bulgaria
- Cyprus
- Czechia
- Denmark
- Estonia
- Finland
- France
- Germany
- Greece
- Hungary
- Iceland
- Ireland
- Italy
- Latvia
- Liechtenstein
- Lithuania
- Luxembourg
- Malta
- Netherlands
- Norway
- Poland
- Portugal
- Romania
- Slovakia
- Slovenia
- Spain
- Sweden
- Switzerland
- Turkey
- United Kingdom
1990-2009
Additional information
'Contribution to change' plots show the contribution to the total emission change between 1990-2009 made by a specified sector/ pollutant. A negative value (-51%) indicates that this sector contributes to the total reduction in emissions of acidifying substances (by 51%). A positive value indicates an increase in emission in this sector and a negative impact on the total reduction in emissions.
Data for Greece, Iceland, Luxembourg and Turkey not available.
