next
previous
items

Figure

EU and global consumption of controlled ozone-depleting substances

Figure Created 06 Sep 2024 Published 13 Sep 2024 Last modified 13 Sep 2024
1 min read
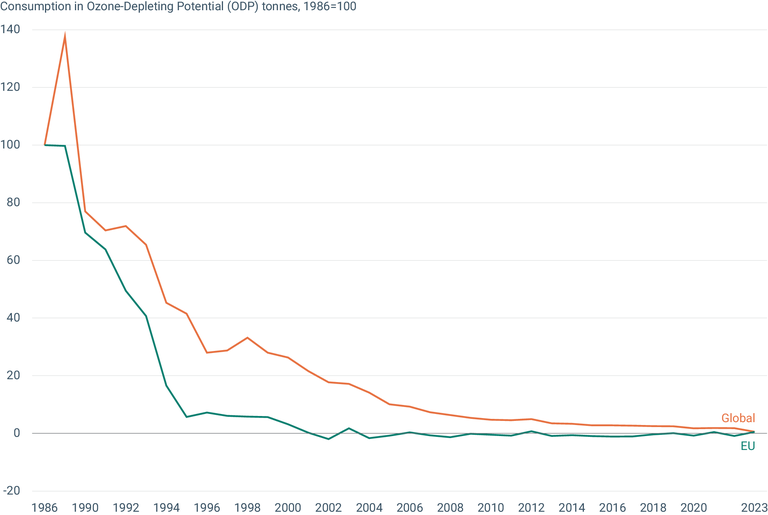
The figure shows the consumption in Ozone-Depleting Potential (ODP) tonnes from 1986 to 2023

European data

Metadata

Additional information

Figures show the percentage consumption in ODP tonnes relative to ODS consumption in ODP in 1986 (calculated from UNEP Ozone Secretariat data).


Geographical coverage
EU level: EU-25 for 2006, EU-27 for 2007-2012, EU-28 for 2013-2019 and EU-27+UK for 2020, and EU-27 for 2021-2023
Global level: All parties registered under the Montreal Protocol

Document Actions