All official European Union website addresses are in the europa.eu domain.
See all EU institutions and bodies
An official website of the European Union | How do you know?
Environmental information systems
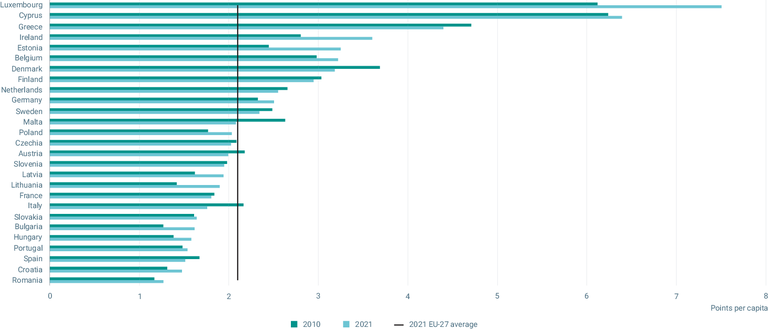
The graph shows the level of aggregated environmental impacts associated with the consumption of each EU Member State, expressed in points per capita for the years 2010 and 2021, sorted from the country with the highest impacts to the country with the lowest impacts in 2021.
Loading