All official European Union website addresses are in the europa.eu domain.
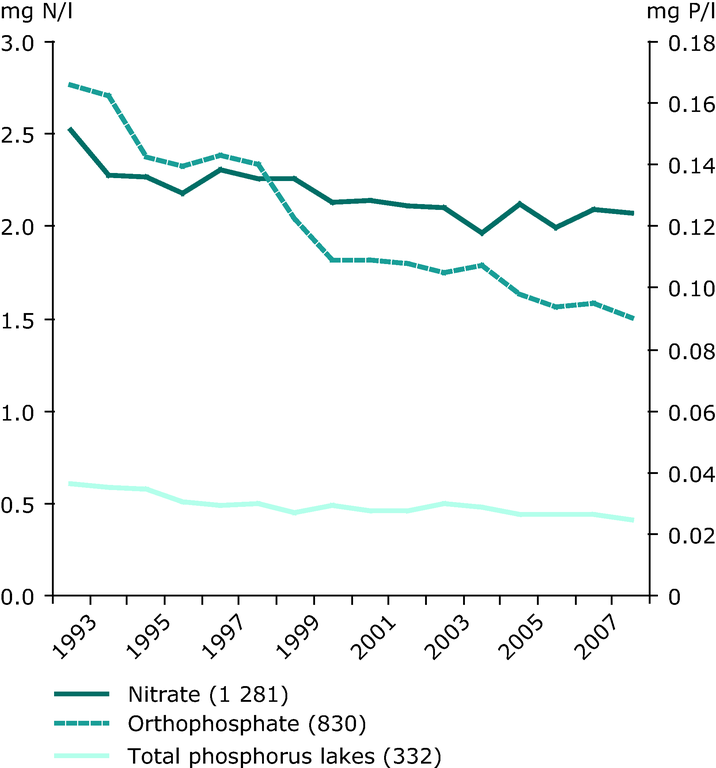
See all EU institutions and bodiesConcentrations of nitrate and orthophosphate in rivers and total phosphorus in lakes in the period 1992–2007
Chart (static)
Total number of stations in parenthesis. Concentrations are expressed as weighted means of annual mean concentrations for rivers and lakes. Only stations with time series of seven years or more are included.

- Austria
- Belgium
- Bulgaria
- Cyprus
- Czechia
- Denmark
- Estonia
- Finland
- France
- Germany
- Greece
- Hungary
- Ireland
- Italy
- Latvia
- Lithuania
- Luxembourg
- Malta
- Netherlands
- Poland
- Portugal
- Romania
- Slovakia
- Slovenia
- Spain
- Sweden
- United Kingdom
- The average nitrate concentration in European rivers has decreased from 2.5 to 2.1 mg N/l since 1992.
- Nutrient levels in lakes are in general much lower than in rivers, but there has also been a 15 % reduction of the average concentrations in lakes.
- Phosphorus concentrations in European rivers and lakes generally decreased during the last 15 years.
- Between 2004 and 2007 nitrate concentrations in surface water remained stable or fell at 70 % of monitored sites and quality at 66 % of groundwater monitoring points is stable or improving (EU, 2010).
Geographical coverage:
Nitrate in rivers: Austria, Belgium, Bulgaria, Czech Republic, Denmark, Estonia, Finland, France, Germany, Hungary, Lithuania, Luxembourg, Norway, Poland, Slovakia, Slovenia, Spain, Sweden, Switzerland.
Orthophosphate in rivers: Austria, Belgium, Bulgaria, Denmark, Estonia, Finland, France, Germany, Lithuania, Luxembourg, Norway, Slovakia, Slovenia, Spain, Sweden, Switzerland.
Total Phosphorus in lakes: Austria, Denmark, Estonia, Finland, Hungay, Ireland, Lithuania, Latvia, Slovenia, Sweden, Switzerland.
