All official European Union website addresses are in the europa.eu domain.
See all EU institutions and bodies
An official website of the European Union | How do you know?
Environmental information systems
Loading
All official European Union website addresses are in the europa.eu domain.
See all EU institutions and bodiesChart (static)
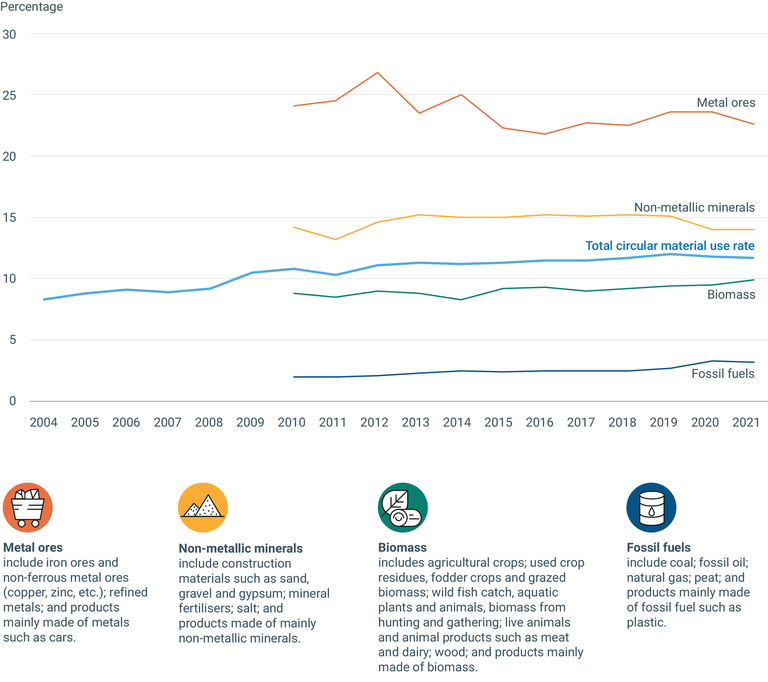
No breakdown by material category available for 2004-2009.