All official European Union website addresses are in the europa.eu domain.
See all EU institutions and bodiesAn official website of the European Union | How do you know?
Environmental information systems
Chemical status of groundwater bodies
Chart (static)
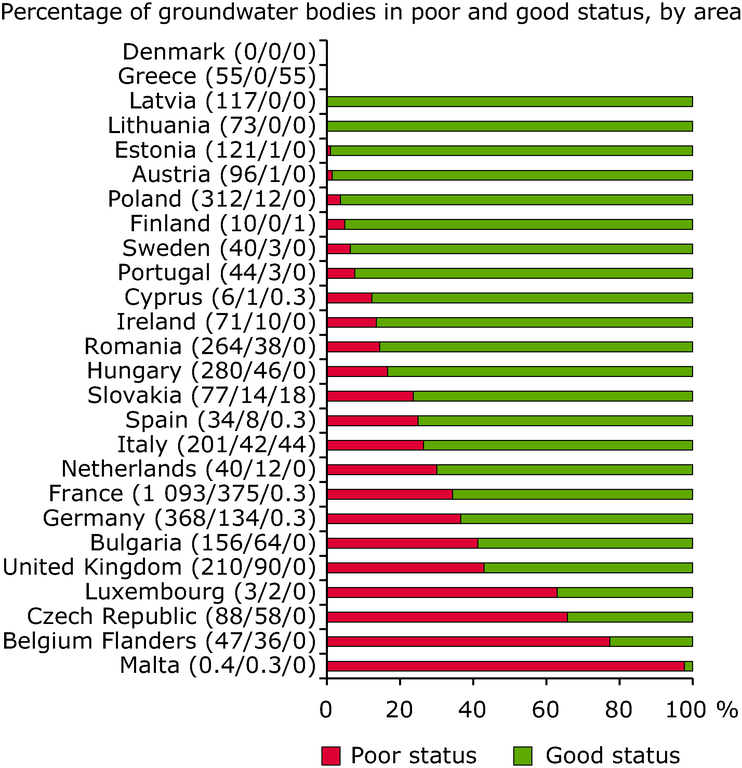
The graphs illustrate the chemical status of groundwater, Percentage of groundwater bodies in poor and good status, by area.

Downloads
Data sources
Metadata
More info
Loading
- Greece
- Poland
- Romania
- Portugal
- Spain
- United Kingdom
- Netherlands
- Belgium
- Germany
- France
- Czechia
- Italy
- Cyprus
- Estonia
- Latvia
- Lithuania
- Finland
- Hungary
- Bulgaria
- Malta
- Denmark
- Sweden
- Austria
- Luxembourg
- Ireland
- Slovakia
- Slovenia
2005-2009
Groundwater bodies in unknown status are not accounted for in the red and green bars that represent the percentage for poor and good status respectively. The reported total area covered by groundwater bodies/the area in poor status/the area in unknown status (in 1 000 km2) per Member State is shown in parentheses. Denmark and Slovenia did not report the area of groundwater bodies, whilst 164 of 385 (43 %) Danish groundwater bodies were reported as holding poor chemical status, and 4 of 21 (19 %) Slovenian groundwater bodies were reported as holding poor chemical status
